Mouse Cerebellum (Slide-seqV2)#
[70]:
import sys
sys.path.append('E:/Anaconda/envs/SpaVAEW/Lib/site-packages/')
import glob
import numpy as np
import pandas as pd
import scanpy as sc
import matplotlib.pyplot as plt

import SpaGTL
Data loading and preprocessing#
The dataset(including Slide-seqV2 data, marker genes list) is available at Single Cell Portal (https://singlecell.broadinstitute.org/single_cell/study/SCP948). We load the dataset and perform preprocessing log transformation.
[71]:
Slide_seq=sc.read_h5ad('E:/data/Slide_seq_brain/data/Cerebellum.h5ad')
Gene=pd.read_csv('E:/data/Slide_seq_brain/Gene.csv',index_col=0)['x']
Annotation=pd.read_csv('E:/data/Slide_seq_brain/annotation.csv',index_col=0)['first_type']
Slide_seq=Slide_seq[Annotation.index,Gene]
Slide_seq.obs['cell_type']=Annotation
C:\Users\123\AppData\Local\Temp\ipykernel_7116\4010773200.py:5: ImplicitModificationWarning: Trying to modify attribute `.obs` of view, initializing view as actual.
  Slide_seq.obs['cell_type']=Annotation
[108]:
Slide_seq.obsm['spatial']=Slide_seq.obsm['spatial'].values
[109]:
sc.pl.embedding(
    Slide_seq,
    colorbar_loc=None,
    frameon=False,
    basis='spatial',
    color=['cell_type'],
    size=50,
    show=False
)
E:\Anaconda\envs\sparcl\lib\site-packages\scanpy\plotting\_tools\scatterplots.py:392: UserWarning: No data for colormapping provided via 'c'. Parameters 'cmap' will be ignored
  cax = scatter(
[109]:
<AxesSubplot: title={'center': 'cell_type'}, xlabel='spatial1', ylabel='spatial2'>
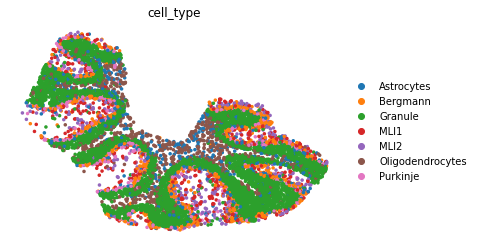
Spatial reconstruction#
We perform spatial reconstruction to aggregate expression from spatial neighbors.
[72]:
SpaGTL.spatial_reconstruction(Slide_seq, alpha=8)
Graph Transfer Learning#
We perform graph transfer learning on the preprocessed data.
[73]:
params_dict = np.load('E:/江小白/data/params_dict.npy', allow_pickle=True).item()
intersection = [value for value in params_dict['genes'] if value in Slide_seq.var_names]
len(intersection)
adata=Slide_seq[:,intersection]
SpaGTL.run_SpaGTL(adata, n_epochs=1000,params_dict=params_dict)
100%|█████████████████████████████████████████████████████████████| 1000/1000 [01:37<00:00, 10.28it/s, loss: 6.149e+03]
E:\Anaconda/envs/SpaVAEW/Lib/site-packages\SpaGTL\_SpaGTL.py:156: ImplicitModificationWarning: Trying to modify attribute `._uns` of view, initializing view as actual.
  adata.uns[key_added] = {}
E:\Anaconda\envs\sparcl\lib\site-packages\anndata\_core\anndata.py:1832: UserWarning: Variable names are not unique. To make them unique, call `.var_names_make_unique`.
  utils.warn_names_duplicates("var")
Regulon inference and aucell#
We perform regulon inference using gene relation matrix.
[74]:
from yaml import Loader, Dumper
import glob
MOTIF_ANNOTATIONS_FNAME='E:/data/CisTarget/motifs-v9-nr.mgi-m0.001-o0.0.tbl'
tf_names=np.array((pd.read_table('E:/data/CisTarget/mm_mgi_tfs.txt',header=None).iloc[:,0]))
DATABASES_GLOB='E:/data/CisTarget/mm9-*.mc9nr.feather'
db_fnames = glob.glob(DATABASES_GLOB)
[75]:
SpaGTL.regulons(adata, tf_names, MOTIF_ANNOTATIONS_FNAME, db_fnames, neighbors_var_key='QK')
2024-07-12 20:12:46,550 - pyscenic.utils - INFO - Creating modules.
Create regulons from a dataframe of enriched features.
Additional columns saved: []
We perform aucell to compute the activity of each regulon on each spot.
[76]:
adata.X=adata.layers['x4']
SpaGTL.aucell(adata, normalize=True)
100%|██████████████████████████████████████████████████████████████████████████████████| 94/94 [00:03<00:00, 29.93it/s]
[90]:
adata_aucell = sc.AnnData(adata.obsm['aucell'])
adata_aucell.obs = adata.obs.copy()
adata_aucell.obsm['spatial'] = adata.obsm['spatial'].values
Finding differentially activity regulons#
We find the differentially activity regulons across identified cell types and show the domains and their differentially activity regulons patterns in spatial coordinates.
[91]:
sc.tl.rank_genes_groups(adata_aucell, groupby='cell_type', method='t-test_overestim_var')
[92]:
pd.DataFrame(adata_aucell.uns['rank_genes_groups']['names']).iloc[:10,:]
[92]:
| Astrocytes | Bergmann | Granule | MLI1 | MLI2 | Oligodendrocytes | Purkinje | |
|---|---|---|---|---|---|---|---|
| 0 | Foxo1(+) | Sox2(+) | Etv1(+) | Esrrg(+) | Esrrg(+) | Sox10(+) | Bcl11a(+) |
| 1 | Elf1(+) | Sox9(+) | Foxo3(+) | Mafb(+) | Mafb(+) | Olig2(+) | Lmo2(+) |
| 2 | Sox9(+) | Elk3(+) | Klf6(+) | Msx1(+) | Nfe2l1(+) | Olig1(+) | Mef2c(+) |
| 3 | Arnt2(+) | Pparg(+) | Cux1(+) | Prdx5(+) | Prdx5(+) | Sox8(+) | Nr2f2(+) |
| 4 | Sox2(+) | Etv4(+) | Klf9(+) | Lmo2(+) | Msx1(+) | Creb5(+) | Ikzf2(+) |
| 5 | Tcf7l1(+) | Sox18(+) | Rbpj(+) | Nfe2l1(+) | Ets1(+) | Zfhx3(+) | Foxj1(+) |
| 6 | Etv4(+) | Etv5(+) | Meis1(+) | Foxj1(+) | Arnt2(+) | Arnt2(+) | Ets1(+) |
| 7 | Foxj1(+) | Msx1(+) | Ep300(+) | Arnt2(+) | Etv5(+) | Elf2(+) | Foxp2(+) |
| 8 | Elk3(+) | Foxj1(+) | Rcor1(+) | Ets1(+) | Lmo2(+) | Klf2(+) | Prdx5(+) |
| 9 | Sox8(+) | Nfe2l2(+) | Maf(+) | Etv5(+) | Klf12(+) | Rorb(+) | Msx1(+) |
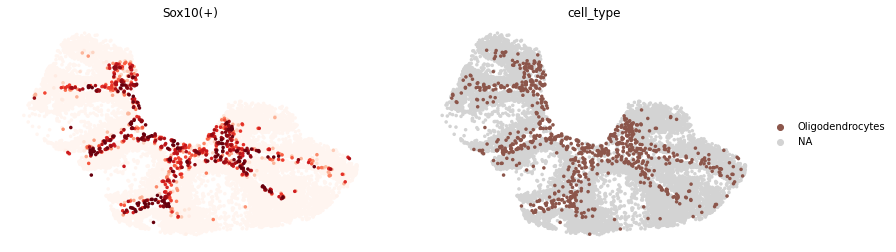
[97]:
sc.pl.embedding(
    adata_aucell,
    colorbar_loc=None,
    frameon=False,
    basis='spatial',
    color=['Sox10(+)','cell_type'],
    size=50,
    groups='Oligodendrocytes',
    color_map='Reds',
    vmax='p99',
    vmin='p90',
    show=False
)
E:\Anaconda\envs\sparcl\lib\site-packages\scanpy\plotting\_tools\scatterplots.py:392: UserWarning: No data for colormapping provided via 'c'. Parameters 'cmap' will be ignored
  cax = scatter(
[97]:
[<AxesSubplot: title={'center': 'Sox10(+)'}, xlabel='spatial1', ylabel='spatial2'>,
 <AxesSubplot: title={'center': 'cell_type'}, xlabel='spatial1', ylabel='spatial2'>]
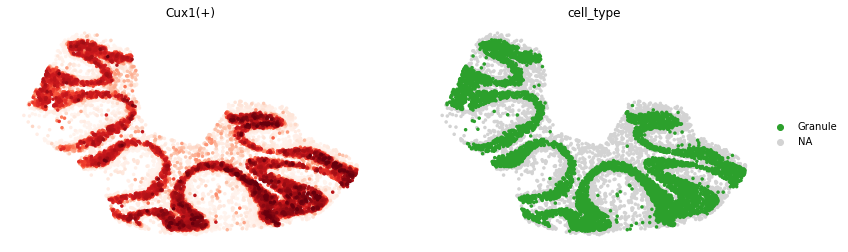
[101]:
sc.pl.embedding(
    adata_aucell,
    colorbar_loc=None,
    frameon=False,
    basis='spatial',
    color=['Cux1(+)','cell_type'],
    size=50,
    groups='Granule',
    color_map='Reds',
    vmax='p99',
    show=False
)
E:\Anaconda\envs\sparcl\lib\site-packages\scanpy\plotting\_tools\scatterplots.py:392: UserWarning: No data for colormapping provided via 'c'. Parameters 'cmap' will be ignored
  cax = scatter(
[101]:
[<AxesSubplot: title={'center': 'Cux1(+)'}, xlabel='spatial1', ylabel='spatial2'>,
 <AxesSubplot: title={'center': 'cell_type'}, xlabel='spatial1', ylabel='spatial2'>]
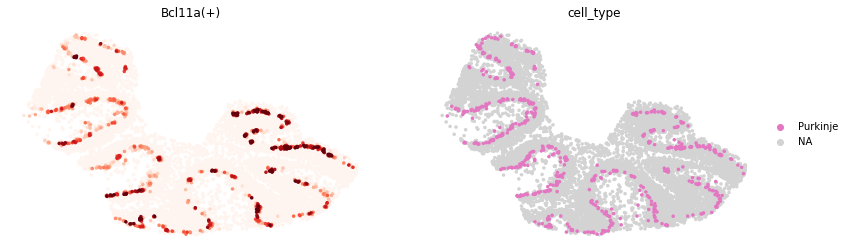
[106]:
sc.pl.embedding(
    adata_aucell,
    colorbar_loc=None,
    frameon=False,
    basis='spatial',
    color=['Bcl11a(+)','cell_type'],
    size=50,
    groups='Purkinje',
    color_map='Reds',
    vmax='p99',
    vmin='p90',
    show=False
)
E:\Anaconda\envs\sparcl\lib\site-packages\scanpy\plotting\_tools\scatterplots.py:392: UserWarning: No data for colormapping provided via 'c'. Parameters 'cmap' will be ignored
  cax = scatter(
[106]:
[<AxesSubplot: title={'center': 'Bcl11a(+)'}, xlabel='spatial1', ylabel='spatial2'>,
 <AxesSubplot: title={'center': 'cell_type'}, xlabel='spatial1', ylabel='spatial2'>]